SMT Divergence: A Powerful ICT Concept for Spotting Institutional Moves
What Is SMT Divergence in ICT Concepts?
SMT Divergence, or Smart Money Technique/Tool Divergence, is a concept within ICT (Inner Circle Trader) methodologies that helps traders identify institutional manipulation in the market. It occurs when correlated assets or markets show conflicting price action, revealing a potential reversal or continuation of a trend.
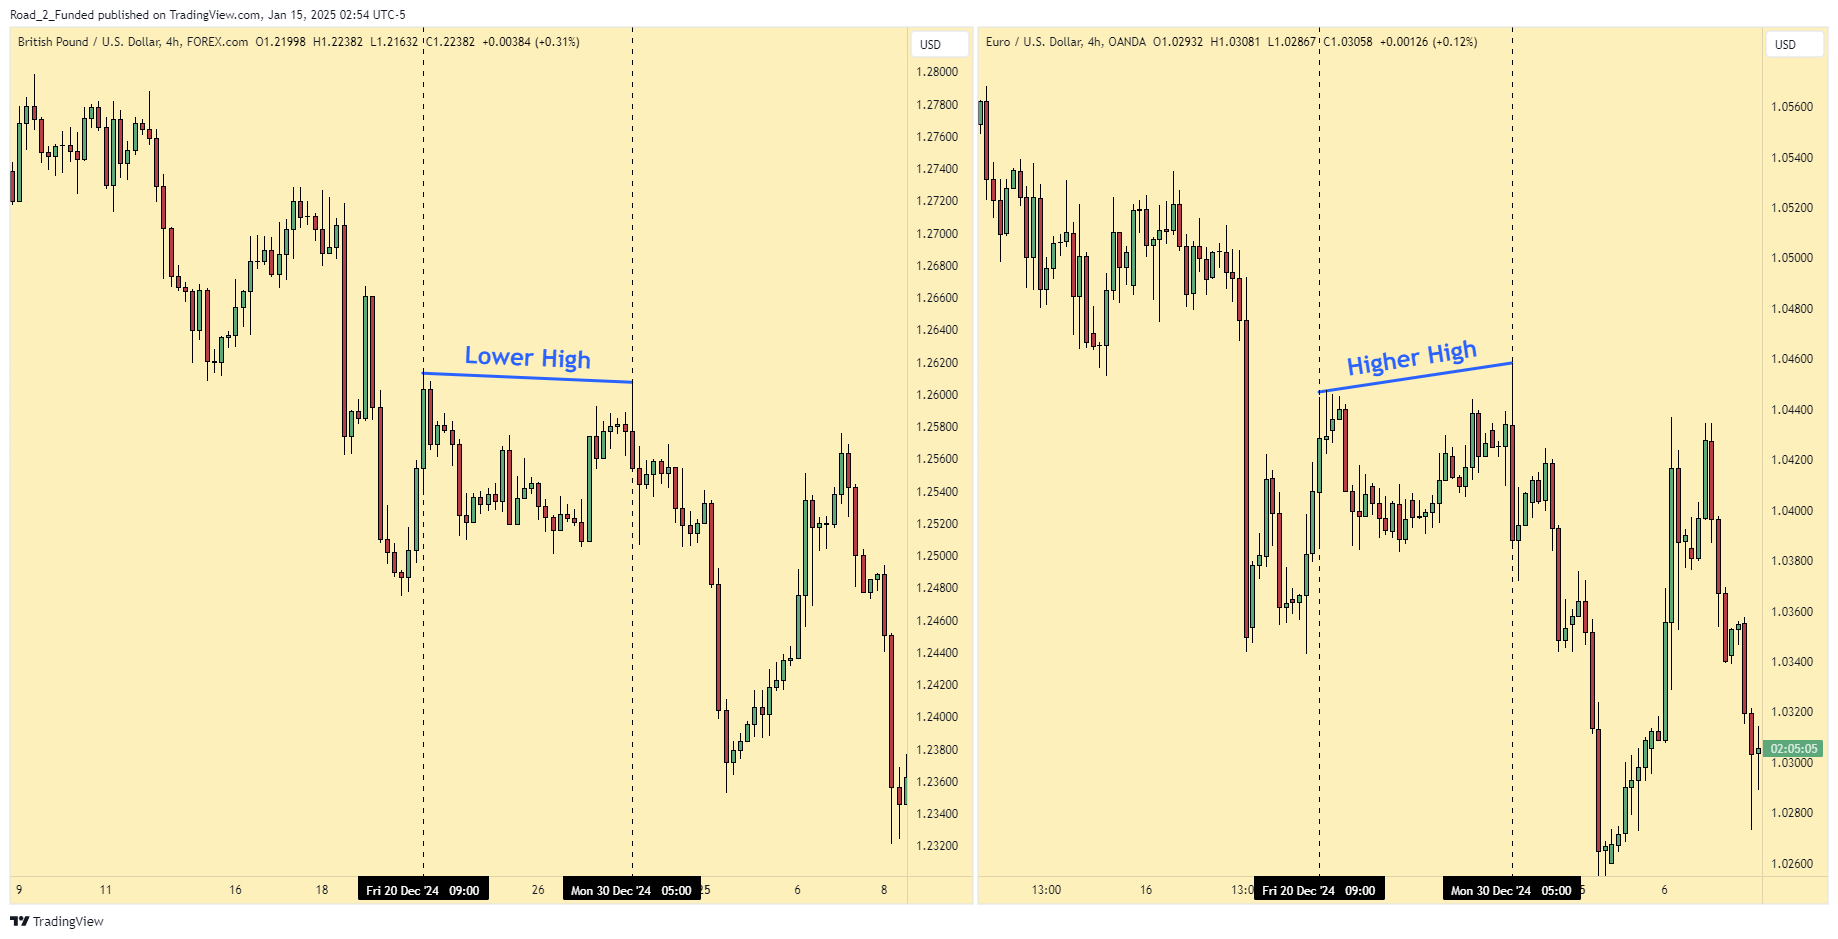
For example, if the EUR/USD pair is making higher highs, but GBP/USD fails to do the same, it indicates a divergence that smart money might be taking advantage of. This mismatch in price action between two correlated instruments is what ICT traders refer to as SMT divergence.
By recognizing SMT divergences, traders can better align their trades with institutional order flow and avoid common retail traps.
Why SMT Divergence Matters in Trading ICT Concepts
Understanding this technique is useful because it provides insight into where smart money is operating. Unlike traditional divergence based on indicators like RSI or MACD, SMT divergence focuses on price action across correlated markets.
Here’s why it matters:
- It Reveals Institutional Intent: SMT divergence highlights areas where institutions might be accumulating or distributing their positions.
- It Confirms High-Probability Setups: By identifying divergence between correlated assets, traders can improve their entry accuracy.
- It Helps Avoid Retail Traps: SMT divergence can help traders avoid false breakouts and stop-hunting moves often used to trick retail traders.
How to Identify SMT Divergence on a Chart
To spot SMT divergence, follow these steps:
- Choose Two Correlated Assets:
Popular pairs include EUR/USD and GBP/USD, US Dollar Index (DXY) and S&P 500, or Bitcoin and Ethereum. - Look for Divergence in Price Action:
Compare the highs and lows of both instruments. If one asset makes a higher high while the other fails to do so, that’s a sign of institutional sponsorship. Remember, if you are using an inverse pair comparison such as EUR/USD and DXY, then observe the lows on one chart and the highs on the other. - Mark Key Levels:
Identify liquidity pools, fair value gaps (FVGs), and order blocks where the price is likely to react. - Wait for a Reaction:
Watch for confirmation of the divergence through candlestick patterns, break of structure (BOS), or other ICT concepts.
Types of SMT Divergence
There are two main types of SMT divergence: bullish and bearish.
1. Bullish SMT Divergence
Bullish divergence occurs when one correlated asset makes a lower low, but the other fails to do the same, indicating that smart money is accumulating positions for a potential reversal to the upside.
Example of Bullish SMT Divergence:
- EUR/USD makes a lower low.
- GBP/USD holds above its previous low.
This divergence suggests that smart money might be preparing for a bullish reversal.
2. Bearish SMT Divergence
Bearish divergence occurs when one correlated asset makes a higher high, but the other fails to do the same, signaling that smart money is distributing positions and a potential downside move is likely.
Example of Bearish SMT Divergence:
- S&P 500 makes a higher high.
- DXY (US Dollar Index) fails to make a lower low.
This divergence hints at bearish continuation or a potential market reversal to the downside.
How to Use SMT Divergence in Your Trading Strategy
Here’s a step-by-step guide to incorporating SMT divergence into your trading strategy:
- Identify Correlated Assets:
Start by selecting two instruments that have a historical correlation, such as forex pairs or indices. - Look for Divergence:
Monitor price action during key timeframes, especially ICT killzones, to spot divergence. - Use ICT Concepts for Confirmation:
Combine SMT divergence with order blocks, fair value gaps, and liquidity pools to confirm your trade setup. - Set Your Stop-Loss and Take-Profit:
Place your stop-loss beyond the previous swing high or low and set your take-profit based on the next key level.
By following these steps, you can use SMT divergence to improve your trade accuracy and align with institutional order flow.
Common Mistakes When Using SMT Divergence
- Overlooking Timeframes:
SMT divergence is most effective on higher timeframes, such as 1-hour, 4-hour, or daily charts. Avoid relying solely on lower timeframes, which can produce false signals. - Ignoring Confirmation:
Don’t act on divergence alone. Always look for price action confirmation before entering a trade. - Misinterpreting Correlations:
Ensure that the assets you’re comparing have a strong correlation. Using unrelated instruments can lead to inaccurate divergence readings.
Conclusion: Why SMT Divergence Is a Key Tool for ICT Traders
SMT divergence is a powerful tool for traders who want to align their strategies with smart money movements. By spotting divergence between correlated assets, you can gain valuable insights into institutional activity and improve your trading accuracy.
Incorporating this into your ICT trading strategy will help you avoid retail traps, improve your timing, and make more informed decisions. As with any trading technique, practice and backtesting are essential to mastering this concept.
Private Coaching
If you’re ready to take your trading skills to the next level and really want to answer the question “is ICT worth it”, book your free discovery session with me today! We’ll discuss your goals, assess your current trading strategy, and create a personalized plan to align you with the edge of trading like smart money.