What Is Market Structure in Trading? A Complete Guide
Table of Contents
Toggle
What Is Market Structure in Trading?
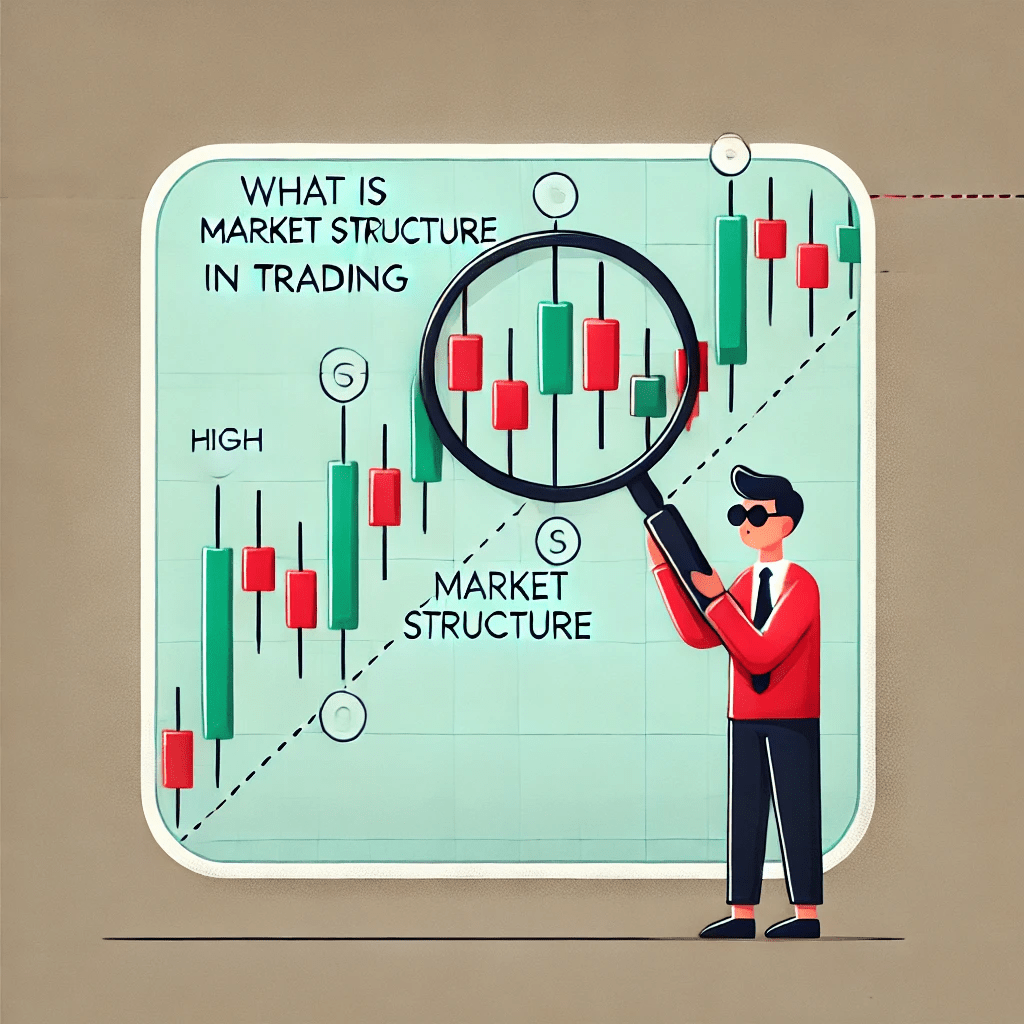
Market structure in trading refers to the way price moves and forms patterns on a chart. It is the underlying framework that defines whether the market is trending, consolidating, or reversing. Understanding market structure helps traders identify the current state of the market and predict where price might go next.
At its core, market structure is all about recognizing higher highs, higher lows, lower highs, and lower lows in price action. By studying these movements, traders can align their strategies with the flow of the market, increasing their chances of success.
Why Market Structure Matters for Traders
Understanding what is market structure in trading is essential for any trader who wants to make informed decisions rather than relying solely on indicators or signals. Here’s why:
- Clear Trend Identification: Market structure helps traders determine if the market is in an uptrend, downtrend, or range-bound condition.
- Improved Entries and Exits: By identifying key levels in the market, traders can enter trades at optimal points and set realistic targets.
- Risk Management: Knowing where price is likely to go allows traders to place stop-losses in more effective locations.
Without a solid grasp of market structure, traders risk getting caught in false breakouts, chasing price, or entering trades at the wrong time.
Types of Market Structure
There are three main types of market structure that traders need to understand:
- Uptrend (Bullish Market Structure):
- Price makes higher highs (HH) and higher lows (HL).
- Indicates that buyers are in control, and the market is likely to continue moving upward.
- Downtrend (Bearish Market Structure):
- Price makes lower lows (LL) and lower highs (LH).
- Shows that sellers are dominating, and the market is trending downward.
- Range-Bound (Consolidation):
- Price moves sideways within a defined range.
- Neither buyers nor sellers have full control, leading to indecisive price action.
These different types of market structure help traders identify potential reversals and continuation patterns, which are critical for making trading decisions.
How to Identify Market Structure on a Chart
To identify what is market structure in trading follow these steps:
- Start with the Higher Timeframe:
Always begin your analysis on a higher timeframe (e.g., daily or 4-hour charts) to get a clear picture of the overall trend. - Look for Swing Highs and Lows:
Identify key turning points in the market by spotting swing highs (peaks) and swing lows (troughs). - Mark Key Levels:
Draw horizontal lines at significant support and resistance levels. These levels often coincide with previous highs and lows. - Use Trendlines:
Connect higher lows in an uptrend or lower highs in a downtrend to visualize the trend more clearly.
By following these steps, you’ll be able to determine whether the market is in a bullish, bearish, or sideways trend.
Common Market Structure Patterns
Several patterns emerge from market structure analysis that can help traders predict future price action:
- Break of Structure (BOS):
A break of structure occurs when price moves beyond a significant high or low, signaling a potential trend reversal or continuation. - Change of Character (CHOCH):
This pattern marks the first sign of a possible trend reversal. It happens when the market shifts from making higher highs to lower highs, or vice versa. - Liquidity Sweeps:
Institutional traders often target liquidity by pushing price beyond a key level to trigger stop-loss orders before reversing the market. - Order Blocks:
These are areas where institutions have placed significant orders, often leading to strong price reactions.
Recognizing these patterns helps traders anticipate market movements and align their trades accordingly.
How to Trade Using Market Structure
Trading based on market structure involves following a systematic approach to analyze price action and make informed decisions. Here’s a step-by-step guide:
- Identify the Trend:
Start by determining whether the market is in an uptrend, downtrend, or range. - Mark Key Levels:
Highlight significant support and resistance areas, as well as any visible order blocks. - Look for Breaks of Structure:
Pay attention to breaks of significant highs or lows, as these indicate potential trading opportunities. - Wait for a Retracement:
After a break of structure, wait for price to retrace to a key level (e.g., order block or fair value gap) before entering a trade. - Set Your Stop-Loss and Take-Profit Levels:
Place your stop-loss beyond the previous swing high or low and set realistic take-profit targets based on the next key level.
By incorporating these steps into your trading strategy, you’ll be able to make more confident and calculated trades.
Conclusion: Master Market Structure to Improve Your Trading
Mastering market structure is one of the most important skills a trader can develop. By understanding how price moves and recognizing key patterns, you can better align your trades with market trends and avoid common pitfalls that many retail traders face.
If you’re looking to improve your trading results, start by focusing on market structure. It’s a fundamental concept that forms the basis of successful trading strategies and can give you the edge you need to succeed in the financial markets.
Private Coaching
If you’re ready to take your trading skills to the next level and learn how to apply Smart Money Concepts in real-time, book your free discovery session with me today! We’ll discuss your goals, assess your current trading strategy, and create a personalized plan to align you with the edge of trading like smart money.
